Design and Analysis of an Experiment
OBJECTIVE- The question I'm trying to answer here is: In the paper helicopter experiment, our interest is to explore how the wing length and wing width would affect the flight time of a helicopter.
Report on Paper Helicopter Experiment
1 Introduction
In the paper helicopter experiment, our interest is to explore how the wing length and wing width would affect the flight time of a helicopter. We predicted that keeping the base dimensions constant, the longer and wider the wing is, the longer is the flight time. Because the larger wing length and wing width will allow the helicopter to be pulled down with more air resistance, thus the flying time will be longer.
2 Experiment Design
2.1 Materials:
16 Paper Helicopter; Stopwatch; 100cm ruler; 16 paperclips
2.2 Procedure:
For our helicopter experiment, we first measured two meters on the wall so we dropped the helicopter at the same place. Then, same person dropped the helicopter with left hand and timed how long it took to helicopter to reach ground by stopwatch in right hand. We repeated the same procedure for all helicopters. Meanwhile, we recorded the flying time.
2.3 Randomization:
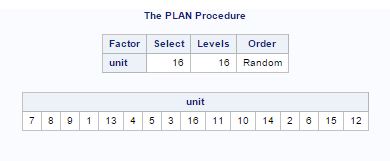
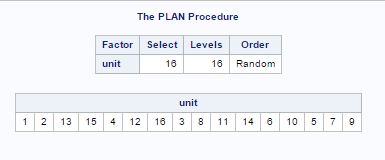
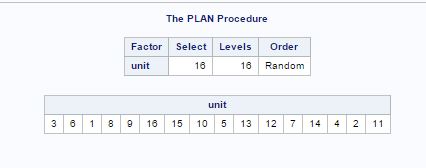
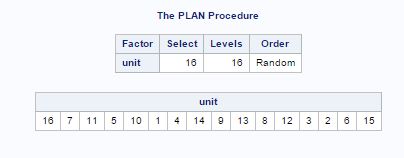
To make our experiment a randomized one, we ran the sas code for randomization using proc plan seed and generated random sequence of 16 numbers(by changing seed value) for our 16 planes and we ran code 4 times for 4 replicates. This is how we make sure the experiment unit is completely randomized.
2.4 Nuisance Factors Control:
We have considered 4 nuisance factors, which might be appearing in our design: the quality of paper, the helicopter maker, variation of reaction time between different individuals, and the weight of the paper clip. Fortunately, we can efficiently control these nuisance factors, thus, we did not include any different blocks in the experiment design.
For the quality of paper, it is obvious that the weight and material of paper will affect the flying time. To control this factor, we made all of the 16 helicopters with the same kind of paper: standard A4 printing paper, from the same paper stack. For the helicopter maker, we believe that different makers will produce slightly different helicopters. To control this part, one of our group members made all of the 16 helicopters. The reaction time is the most difficult part to control. When we were trying to let one person act as the time keeper, another one act as the dropper, we found that it’s very hard for them to cooperate. Since the flying time was very short (less than 2 seconds), any delicate error will would lead to great mistake in our data. We decided to let one person to act as both timekeeper and dropper.
3 Model-
We have chosen the wing-width and wing-length as two factors with four levels each and flight time of the helicopter as response variable. We used 42 factorial design for our experiment design. For each factor combination, there are 4 replicates. The model we fit into our data is:
Yijk=µ+τi+βj+(τβ)ij+ϵijk i=1,2,3,4 and j=1,2,3,4,k=1,2,3,4
Where
µ: grand mean
τi: main effect of the wing-width
βj:main effect of wing-length
(τβ)ij: interaction effect of combination of wing-width and wing-length
ϵijk~N(0,σ2) i.i.d
And the factors are assumed fixed for the experiment.
4 Analysis:
We tested the following hypothesis about equality of wing-width effects, i.e.:
Ho: τ1=τ2=τ3=τ4=0 vs Ha: at least one τi≠0
From the ANOVA table in figure-1, since the F-value corresponds to wing-width in type=III SS is large and corresponding p-value is small, we rejected null hypothesis and concluded that different levels of wing-width has different effects on flight time.
Next we tested the hypothesis of equality of wing-length effects, i.e.:
H0:β1=β2=β3=β4=0 vs Ha: at least one βj≠0
Again from the ANOVA table in figure-1, since the F-value corresponds to wing-length in type III SS is large and p-value is small, we rejected null hypothesis and concluded that different levels of wing-length has different effects on flight time.
We tested the hypothesis of interaction between two factors as well:
H0: (τβ)ij=0 for all i,j vs Ha: at least one(τβ)ij≠0
From the ANOVA table in figure-1, since the F-value corresponds to interaction term in type III SS is large and p-value is small, we rejected null hypothesis and concluded that there is a significant interaction between wing-width and wing-length.
4.1 Interaction plot:
From Figure-2, it is clear that there is a significant interaction between two factors as the lines are not parallel. From the graph, it is clear that flight time is higher at high level of wing-width for all levels of wing-length. There is a slight change in flight time for wing-length at level 2 and there is a decrease in flight time for wing length at level 3 while the wing-width changes from low to high. Changing from low wing-width level to high, the maximum increase in response time can be seen at the wing-length level 4(value=5).
4.2 Model Diagnostic:
To check the model assumption of normal residuals, we plotted the histogram and normal probability plot.
From histogram in figure-3 and normal probability plot in figure-4, the residuals looks approximately normal.
To check the constant variance assumption, we plotted the residuals with predicted value, residuals with wing-width and wing-length respectively.
From residuals vs predicted values in figure-5, there is a slight increase in variance of residuals as flight time increases, but there is no major departure from constant variance assumption. However, there may be some potential outliers in the observations.
From the residuals vs wing-width in figure-6, there is a mild inequality in variance but since there is no major departure from constant variance assumption, we assume this may be due to the presence of outliers. And from the plot of residuals vs wing-length in figure-7, there is again a mild case of non-constant variance, no major departure. Again, we assume this may be due to the presence of outliers.
5 Conclusion-
-
According to our design of the helicopter problem, we found that maximum flight time of helicopter is at the maximum value of wing-length (5 inches) and maximum value of wing-width (2 inches).
-
To have a long flight time, the value of wing-width should be 4 inches or more and wing-width should be 1.25 inches or more.
6 Reference-
1 Douglas C. Montogomery , Design and Analysis of Experiments, eighth edition.
7 Appendix:
Data-
| Wing width (Inch) | |||||
|---|---|---|---|---|---|
| Wing length (Inch) | 1.25 | 1.5 | 1.75 | 2 | |
| 2 | 0.99 0.90 1.05 | 0.98 0.81 0.99 0.83 | 1.00 0.96 1.03 0.91 | 1.06 0.99 1.05 0.98 | |
| 3 | 1.21 1.30 1.36 1.26 | 1.01 1.06 1.00 1.10 | 1.13 1.15 1.23 1.18 | 1.21 1.18 1.08 1.23 | |
| 4 | 1.26 .126 1.25 1.15 | 1.38 1.40 1.36 1.33 | 1.51 1.40 1.50 1.41 | 1.44 1.38 1.39 1.62 | |
| 5 | 1.26 1.33 1.10 1.18 | 1.75 1.75 1.58 1.66 | 1.56 1.51 1.59 1.60 | 1.75 1.61 1.81 1.89 |
Table for randomization-
FIGURES-
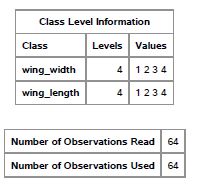
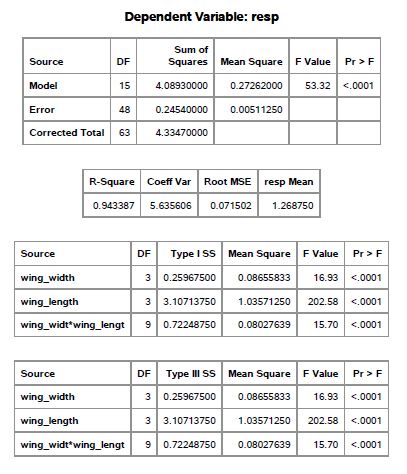
Figure-1
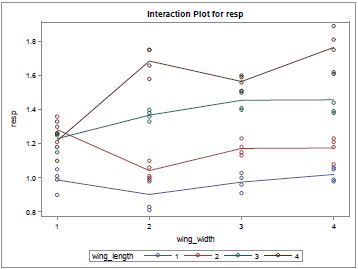
Figure-2
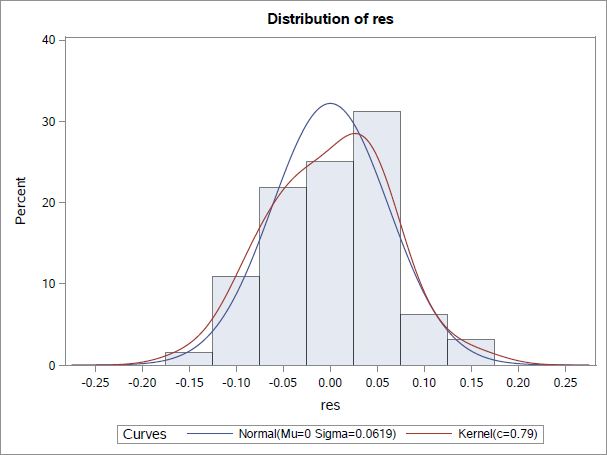
Figure-3
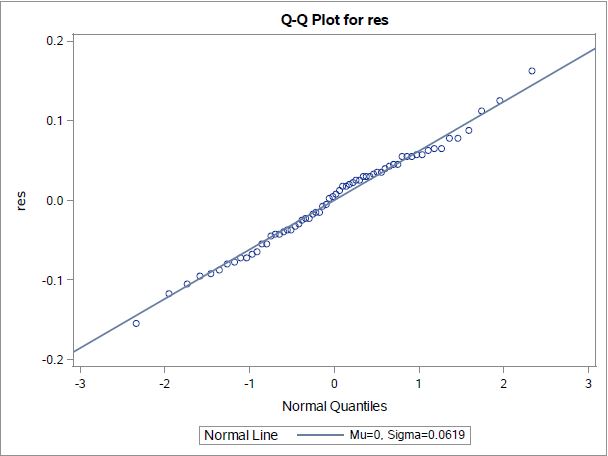
Figure-4
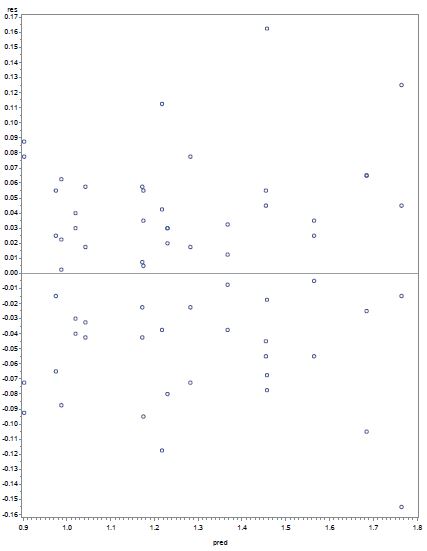
Figure-5
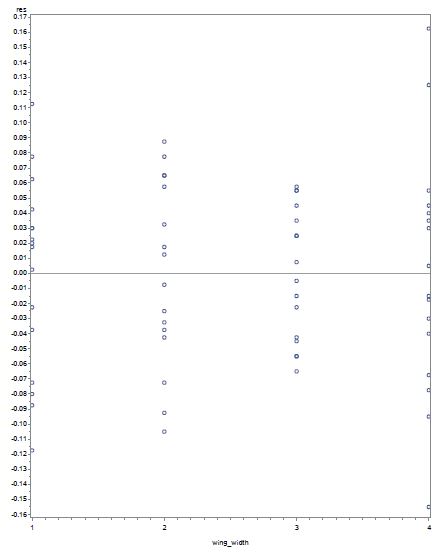
Figure-6
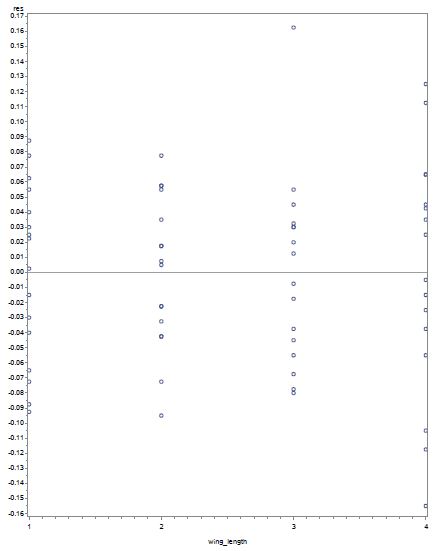
Figure-7
SAS- Code
data project;

input wing_width wing_length resp\@\@;

datalines;

1 1 1.01

1 1 0.99

1 1 0.90

1 1 1.05

1 2 1.21

1 2 1.30

1 2 1.36

1 2 1.26

1 3 1.26

1 3 1.26

1 3 1.25

1 3 1.15

1 4 1.26

1 4 1.33

1 4 1.10

1 4 1.18

2 1 0.98

2 1 0.81

2 1 0.99

2 1 0.83

2 2 1.01

2 2 1.06

2 2 1.00

2 2 1.10

2 3 1.38

2 3 1.40

2 3 1.36

2 3 1.33

2 4 1.75

2 4 1.75

2 4 1.58

2 4 1.66

3 1 1.00

3 1 0.96

3 1 1.03

3 1 0.91

3 2 1.13

3 2 1.15

3 2 1.23

3 2 1.18

3 3 1.51

3 3 1.40

3 3 1.50

3 3 1.41

3 4 1.56

3 4 1.51

3 4 1.59

3 4 1.60

4 1 1.06

4 1 0.99

4 1 1.05

4 1 0.98

4 2 1.21

4 2 1.18

4 2 1.08

4 2 1.23

4 3 1.44

4 3 1.38

4 3 1.39

4 3 1.62

4 4 1.75

4 4 1.61

4 4 1.81

4 4 1.89

;

run;

proc glm;

class wing_width wing_length;

model resp = wing_width wing_length wing_width\*wing_length / solution;

lsmeans wing_width wing_length wing_width\*wing_length/ adjust=tukey tdiff;

output out=diag r=res p=pred;

run;

symbol1 v=circle;

proc gplot;

plot res\*pred/vref=0;

plot res\*wing_width / vref=0;

plot res\*wing_length/ vref=0;

run;

proc univariate noprint normal;

histogram res / normal (L=1 mu=0 sigma=est) kernel (L=2);

qqplot res/normal (L=1 mu=0 sigma=est);

run;

/\* Randomization\*/

\*1;

PROC PLAN SEED=51405100;

FACTORS unit=16;

RUN;

PROC PRINT; RUN; QUIT;

\*2;

PROC PLAN SEED=514051011;

FACTORS unit=16;

RUN;

PROC PRINT; RUN; QUIT;

\*3;

PROC PLAN SEED=51405104;

FACTORS unit=16;

RUN;

PROC PRINT; RUN; QUIT;

\*4;

PROC PLAN SEED=51405103;

FACTORS unit=16;

RUN;

PROC PRINT; RUN; QUIT;